If you don’t know how to analyze your campaign results properly, you won’t detect all the mistakes and improvement opportunities.
Here are a few tips for performing better analysis in less time:
11.1. Add more columns to the reports
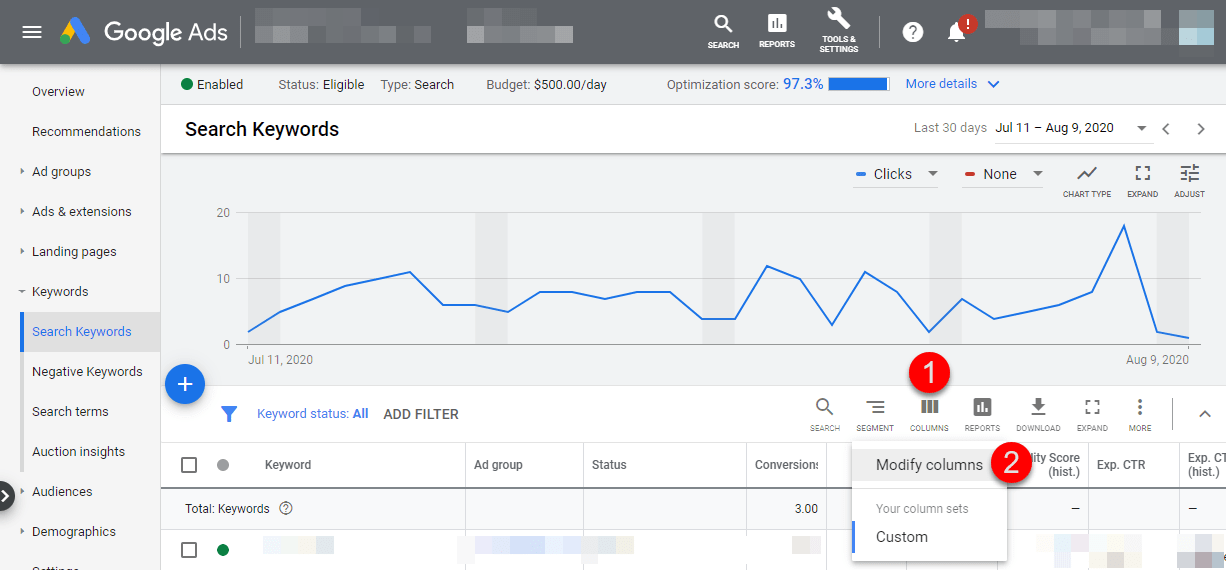
Surprisingly, some Google Ads reports don’t show by default some metrics that are important to analyze the results properly.
To add a new column, you must simply click on the ”COLUMNS” element and then on ”Modify columns”:
Then select all the metrics that interest you on the new page that opens, sort them on the right according to the order you want them to be displayed in the report and click ”APPLY” (you can also save that set of columns to reuse later):
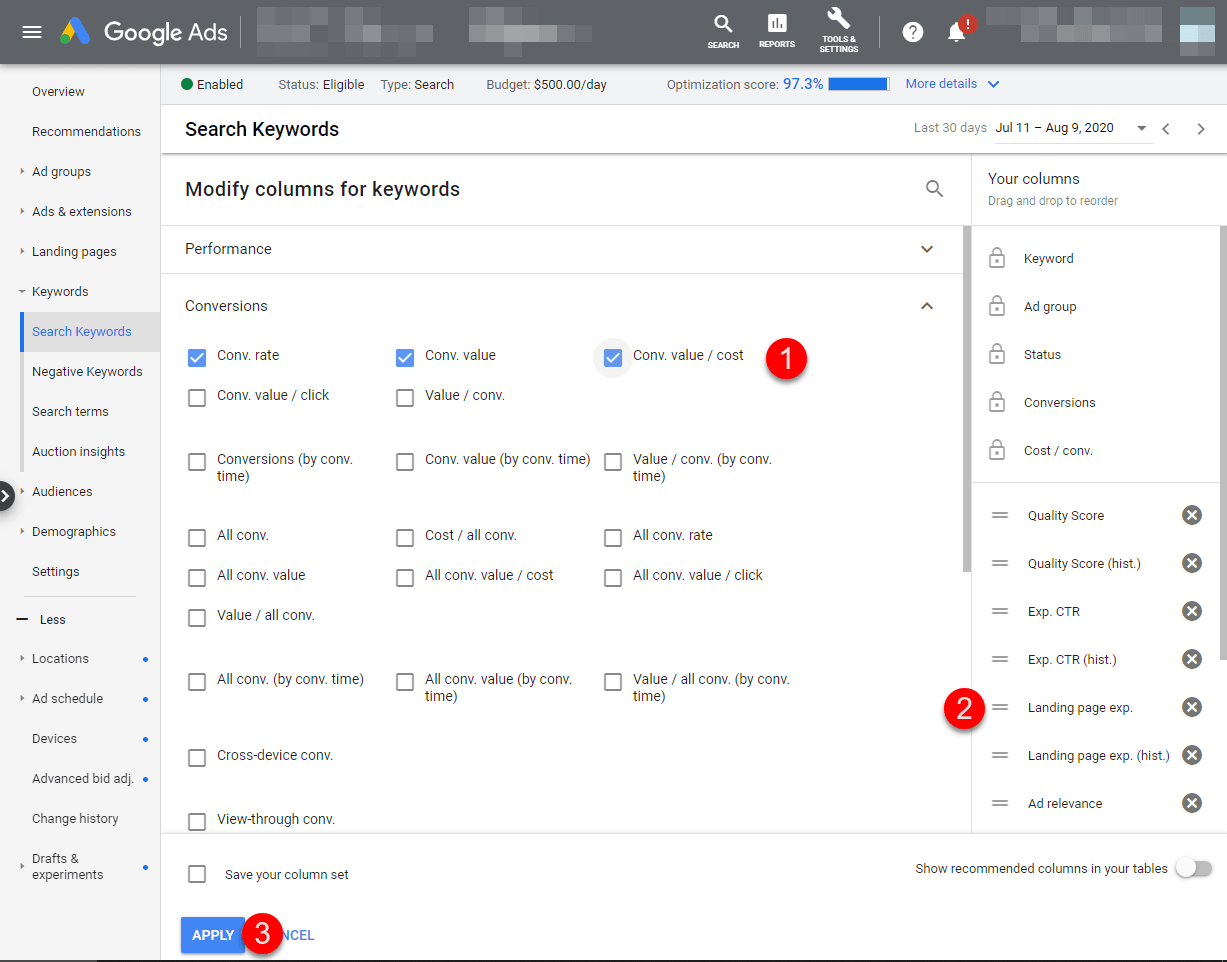
Depending on the specific report we are checking and what we want to detect, we should add some metrics or others, but some generally useful ones are:
- Cost
- Conversions
- Conv. value (if you have configured a value for your conversions)
- Cost/conv.
- Conv. rate
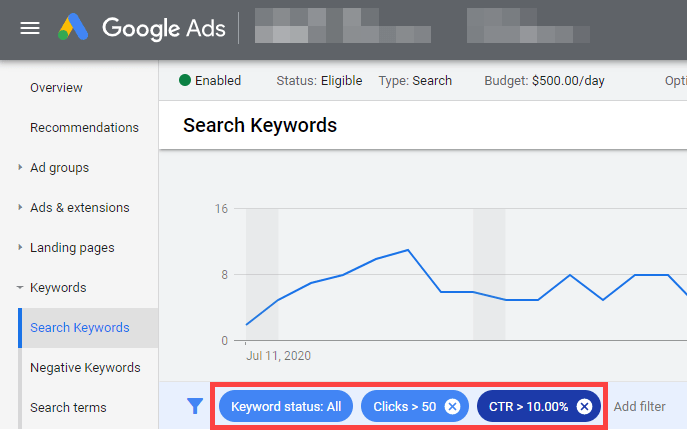
11.2. Use filters to save time
Reviewing large listings of keywords or other variables can be quite time-consuming. And if you are not careful, you can get lost in a ”sea of data” and overlook important improvement opportunities.
One way to save time and make analysis easier is to apply filters to reports, to see only items that meet certain criteria. It’s also useful to sort the report by the most important metric.
To apply a filter, simply select ”ADD FILTER” in the report you are viewing, search for the metric you want, select a value for the filter and click ”APPLY”.
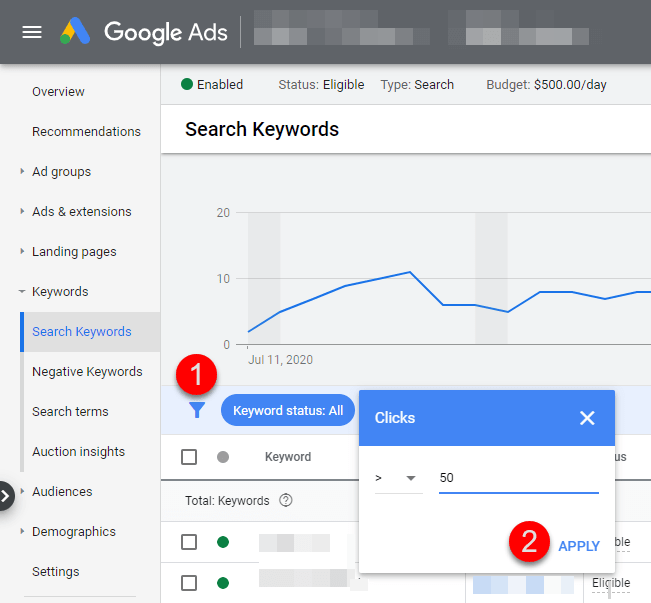
We can apply several filters simultaneously to perform more sophisticated analysis or detect faster what we are looking for exactly: