What is an A/B test?
A/B tests allow you to simultaneously test 2 versions (or more) of a web page to see which one gets better results (more donations, subscribers or whatever you want). It can be a change in a specific web page (for example, a different text) or something that affects the whole website (for example, a design change).
Usually, version A is shown at 50% of visitors and version B to the other 50% (but percentages can be changed).
You need to leave the test running enough time to collect enough data (depending on the volume of visitors can be from 1 week to several months). At the end of the test, you will know which option gives better results and how big is the difference (for example, the version B gets 30% more donations than version A, with 95% confidence).
A/B tests are the only really reliable way of knowing the impact that a specific change has. If a change is implemented directly (without an A/B test), the results can be skewed by external factors (other website changes, new campaigns, holidays, etc.).
You can also do A/B tests for emails, online ads and even offline initiatives (but that’s harder to track and measure), not just website changes.
Requirements and recommendations for performing A/B tests
You need enough traffic and conversions
A/B tests need enough data to be statistically reliable. If you perform a test with only a few users/visitors, the results will be very unreliable and can lead you to wrong decisions.
In order to perform an A/B test without having to wait many months to see reliable results, it’s necessary to have enough users (many visitors to the pages where you are changing something) and enough conversions (many visitors doing the action that you want to measure as a success, such as donating or submitting a form).
There are calculators to know how many visitors or how much time you will need, based on the current conversion percentage and the number of versions we want to try in the test. You can try more than 2 versions simultaneously, but each version that you add will make you have to wait longer to have reliable results):
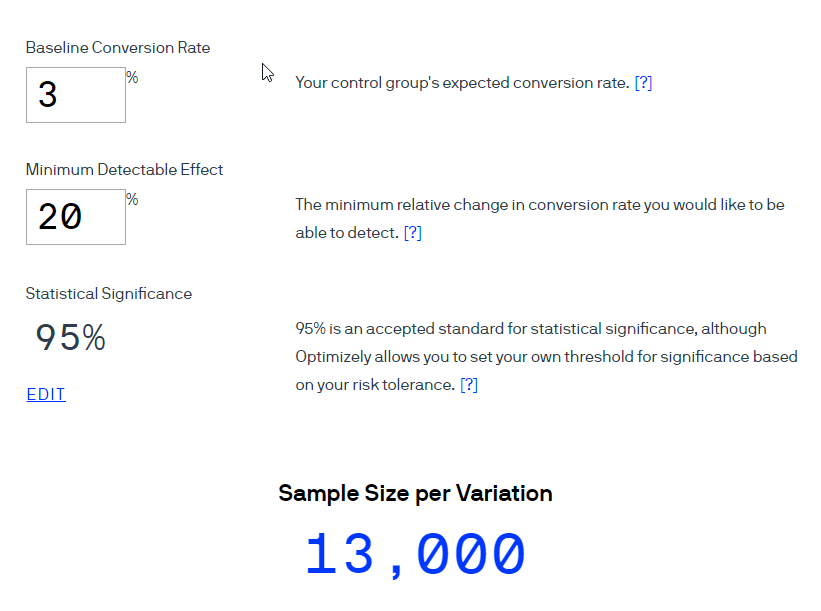
If the calculators indicate that you would need many more visitors and conversions than you currently have to complete the test in a few weeks, the A/B tests probably should not be the priority for your organization. Look at the “Alternatives to A/B tests” section to see what you can focus on instead.
Focus first on detecting problems
If you start trying things almost randomly, without really knowing what you are trying to fix and why, it is unlikely that you will achieve great results.
You are much more likely to get big improvements if the tests are based on problems and opportunities that you have detected. For example:
- A Google Analytics report that indicates at which stage of the donation process more potential donors are being lost.
- A survey of donors or web visitors where they tell you what they are missing on your website or your donation page.
- Recurring criticisms that you have received in emails, online chats, social networks, events…
Prioritize according to resources and potential impact
It is essential to have a strategy to prioritize tests, so you don’t waste your time and energy with tests that are not going to make a significant difference.
Performing tests does not require much money, but there is an opportunity cost (the cost of wasting time with a test that is not important, when you could be doing a test that multiplies the donations of your organization).
Technically you could launch dozens of simultaneous tests on the same website, but there is a chance that some of them affect each other and end up distorting the results. Therefore, it’s better to avoid doing a lot of simultaneous tests, especially if they may have some influence on each other (like doing several tests that affect the same page).
Each experiment usually needs several weeks to give statistically reliable results (generally between 2 and 8 weeks), so only a limited number of experiments can be launched per month.
That is why it is essential to make a list of ideas for tests and prioritize them according to two primary criteria:
- Resources required by the test (if it will take much time or money to prepare it)
- Potential impact of the test (if the change we want to test is expected to produce a large increase in donations or not)
Therefore, it is usually better to start with simple changes that can have a large impact, such as changing the texts and photos you show on the donation page or the homepage of your website.
Choose the right type of test
There are two main types of tests:
A) A/B tests
2 different options are presented to the user (2 web pages, 2 emails, 2 ads, etc.) to know which of them provides the best results.
This is the simplest form of testing, since it is easy to prepare, easy to understand and has lower technical requirements (there are several free tools to perform A/B tests, requires fewer data to reach statistically reliable results, etc.).
You can also do A/B/n tests, which are exactly the same but with more than 2 options (“n” additional options). But you have to know that the more options you want to try, the more time it will take to reach reliable results.
B) Multivariate tests
It’s a more complex type of experiment, aimed at determining the effect of different variables on a page.
For example, we may want to optimize a specific page, for which we want to test at the same time 3 types of buttons, 3 images and 3 different titles, to see which ones work best. Instead of having to prepare a page with each of the possible combinations (27 in this case), we can simply tell the multivariate test software that we want to test those 9 elements and the system will take care of the rest.
It will do all the changes automatically and record the results obtained for each variant. In the end, it will tell you the effect of each element (for example, the red button has increased the conversions by 10%, the blue one has lowered them by 3%, the title 1 has increased them by 15 %, etc.).
Multivariate testing has two main disadvantages:
- It requires more complex and usually more expensive software
- It requires much more data (more visits and conversions) to reach reliable results, because there are usually a lot of combinations to test.
That makes this type of experiments recommended mainly for websites with millions of visits. In small websites it could take years to achieve statistically reliable results.
Choose the right metric
We have to decide which variable will determine the winning version. It can be number of donations, total amount donated, number of visits to the donation page, number of people interested in volunteering, number of subscribers, number of shares in social networks…
In general, you should try to choose a metric that is as closest as possible to the final goal you are looking for (such as increasing the number of completed donations, not just the visits to the donation page).
However, there are at least two situations in which this is not advisable:
- If many donations occur offline, via check or bank transfer (and therefore will not be registered by Google Analytics or the A/B test system).
- If you receive very few online donations. In this situation, it would be practically impossible to reach statistically reliable results if you take completed donations as a metric of the tests (few donations = little data = poor reliability).
In these cases, the best solution is usually to establish as a metric something that happens in the initial steps of the donation process and that is easier to measure online. For example, visits to the donation page, if we are measuring the impact of a change that is outside of that page. That way we will more data and we will be able to make decisions quicker.
Don’t end the experiments too soon
If you launch a test and in the first days one of the alternatives achieves much better results than the other, statistics will quickly indicate that you have a high % of statistical confidence. However, it can be just a coincidence, and can only verify that if you leave the test running more time to get more data.
For example, if you throw a coin, in the long run it is going to be heads 50% and tails 50% of the throws. However, you can throw the coin 10 times and get tails 8 times for example. If you stop there, you could think tails is the “winner of the test”, but it’s a wrong conclusion.
Therefore, it’s crucial to leave tests running for enough time to have a truly representative sample (in web experiments, we recommend a minimum of two weeks).
Even if your website has a lot of traffic, we recommend leaving the tests for at least one week because sometimes the results are different depending on the day of the week (different users/behaviors on weekends, for example).
Beware of experiments performed in abnormal circumstances
For the results of an experiment to be reliable in the long term, the experiment must have been carried out in circumstances similar to those that will be found later.
If it’s done during abnormal circumstances, they can skew the results and lead us to wrong decisions.
For example, if you run a test in December (when people donate more and in different ways/quantities than the rest of the year), the winning version may not be the best for the rest of the year.
It can also be deceiving to run tests while your website is receiving many unusual visitors (for example, because your organization has appeared in the press), which may not behave like the usual visitors (which are the important ones in the long term).
You can directly choose not to perform experiments in abnormal circumstances (holidays, new campaign launches, etc.) or to let those experiments run for longer than usual (outside of the “abnormal period”).
Put the results in quarantine
This is a step that you will not see in most guides, but it’s essential to achieve the best possible long-term results.
Once you have finished a test, sometimes you implement the winner version but it doesn’t have the same results seen during the test. This can happen for different reasons:
- Experiments performed incorrectly or in circumstances that distort the results.
- New variables that did not exist during the experiment.
- Novelty effect (versions that work well at the beginning, only because they are new, but after weeks lose their positive effect).
Although these problems are not very frequent, it is convenient to track the changes for a few weeks after the test, to see if the changes that won the test really have the expected effect.
We also recommend reviewing old experiments and changes once in a while. Usually what worked well today will work well for years, but not everything will remain the same forever.
For example, something that has worked well in the past may stop working due to changes in marketing strategies, new technologies, new competitors, economic crises, changes in the sector, etc.
Therefore, we recommend a yearly review of all past tests to analyze which ones it might be convenient to test again, according to the new realities.
Establish a process of continuous improvement
The testing process does not end with the first improvement you get, you should continue performing more tests to continue refining and further improving the results. It’s a recurring process of continuous improvement.
Therefore, as soon as you have finished an experiment, you have to ask yourself what will be the next experiment that you are going to launch. If you have achieved a significant improvement, do not mark that as “optimized” and put it in a drawer. First, consider how you could take advantage of what you learned to improve that page or element further.
For example, if you have achieved a significant improvement by adding one testimonial from a satisfied customer, try adding 3 or 4 testimonials to see if the results improve even more.
Also, consider how to apply what you have learned in other areas. For example, if you have improved the conversion of a web page by using a new “sales pitch” in the title, try entering that same pitch in your online and offline ads, emails, brochures, etc.
We recommend you keep a record of all the experiments performed (including screenshots, results statistics and comments). It will help you develop conclusions about what works and what doesn’t.
Tools for A/B tests
A/B tests can be applied not only for websites but for other mediums such as emails and ads. Each medium requires a specific tool:
Webs
For A/B tests on websites, we recommend Google Optimize to start. It has a free plan, easy integration with Google Analytics and is relatively easy to use. There are also many good paid tools, such as VWO and Optimizely.
There are also specific plugins for systems such as WordPress to run some kind of tests (e.g., https://wordpress.org/plugins/simple-page-tester/ and https: / /wordpress.org/plugins/nelio-ab-testing/).
And there are also open source solutions to perform A/B tests at no cost and without sharing data with any company (e.g., http://vanity.labnotes.org/). But they require advanced knowledge to configure them correctly and avoid analysis mistakes.
Emails
You can also perform A/B tests of emails if you are using email marketing tools. Most tools already have A/B testing features, to check which version get higher open rate and click-through rate.
We usually do this tests by sending the A/B test to a small part of the recipient list (20% for example) and then send the winner version to the remaining 80%. If you put more recipients in the test, your results will be more reliable, but more people will see the loser (the version that gives worse results).
Ads
You can easily do A/B tests of ads in Google Ads and Facebook Ads. Their dashboards offer options for testing several versions of an ad at no additional cost.
You can check their official guides on how to configure it:
Precautions while choosing tools
Most commercial tools are quite reliable, but if you want to be sure you can start by performing an A/A test.
You launch a test in which the 2 versions are exactly the same (that’s why it’s called “A/A” instead of “A/B”) and therefore should give the same results.
If, after running the test for a long time (minimum 1 month), the software tells you that there is a clear winner (a statistically significant difference between the 2 versions), something is wrong. Either the tool is unreliable or there is a configuration problem.
Alternatives to A/B tests
If after doing calculations or tests you have seen that you do not have enough traffic and conversions to make reliable A/B tests in a reasonable period of time, it’s better that you concentrate on other ways to optimize your donation process.
They will not be as reliable as an A/B test, but it’s better than not testing possible improvements or making changes according to subjective criteria (without supporting data).
There are 3 main alternatives:
A) Focus on solving evident problems
You should do a comprehensive analysis of what it’s wrong in your donation process and what you could improve to increase donations.
This is always important, but if you cannot perform A/B tests it’s even more crucial, because you cannot easily test many variants. So you should gather all the possible information to increase the chances of “hitting the bullseye” with your changes.
If you detect something that is clearly not working or many people tell you that you should improve something in particular, you will not really need A/B tests, because it’s almost certain that you will improve results by correcting that aspect.
Some sources of useful information are:
1) Web analytics data (Google Analytics, heatmaps, web recordings…). We have already covered this in much detail in the document “Web analytics to increase donations“. It’s a source of crucial information to detect possible problems on your website.
2) Surveys to donors, subscribers and web visitors. It can be interesting to conduct surveys of users who visit the donation page but do not end up donating, to discover why they are not completing the donation process. You can ask them things like “Do you have any questions or problems?” or “Should we improve something on this page to help you donate more easily?” You can use tools like Hotjar to perform these mini-surveys on your website.
3) Web usability testing. It’s about seeing how real people navigate your website and tell you what problems or doubts they have while doing it. It can be done in a professional way (there are companies specialized in this such as UserTesting). Or simply ask your contacts to browse your website (or specifically try to make a donation) and tell you their impressions at the same time (if possible in person, since it usually gives more information). It must be done with people outside the organization, because users who already know a website often navigate differently from the rest.
4) Review opinions in search of things that are worth correcting or strengthening (all claims, suggestions and praises received in recent months from donors or potential donors). They may have come from emails, chats, calls, comments on social networks, events, etc. And of course ask staff and volunteers, to check if there are clear patterns (frequent complaints, reasons to decide to donate or not to donate that are mentioned a lot, initiatives that they love or hate…).
B) Test changes without A/B tests
If you are not sure about the effect that a change will have, but you also do not have enough volume to perform reliable A/B tests, the simplest solution is simply to implement the change and wait to see results.
This is a good option if your organization has steady results (donations do not vary much between different weeks/months) and if you are not making other changes at the same time. In that case, it’s reasonable to assume that if you make a change and see a significant improvement in results that is maintained for several weeks, that change is the cause of the improvement.
It’s the easiest option of all, because you do not have to configure or analyze A/B tests.
However, if in your organization the results are unsteady (they vary significantly between different periods even without making any changes) or you are making many changes at the same time (changes in your websiste, new promotional campaigns…), the results will not be reliable and lead to incorrect decisions.
A/B tests are used to prevent these other factors from “contaminating” the results and making us draw erroneous conclusions (confusing correlation with causality).
For those cases, we recommend the following option:
C) Perform A/B tests with limitations
It’s usually recommended to perform A/B tests that reach a minimum 95% statistical confidence. Some tools do not give a winner until the test reaches that level. That 95% which means that we have a 5% chance of making mistakes (that the winner version is not really better than the other one and can even be worse).
However, that is an arbitrary level. If we don’t have enough traffic to reach that 95% within a reasonable time frame, we could settle for 90% or even 80% statistical confidence (which requires considerably less volume and time). There is a higher chance of making mistakes, but it would still be less “risky” than the other main option (making changes without reliable data of what impact they cause).
Another alternative (complementary) is to change the goal we take as a reference for the A/B test, looking for goals/conversions that have more volume. For example, if we have few donations completed but many clicks on the donate buttons, we could establish the clicks on those buttons as the main goal of the A/B test. This way, we would have more conversions volume and we could perform A/B tests with statistically reliable results in less time. Obviously, this is less accurate because clicking on the donate button does not imply that they end up donating, but if the total donations go up as well, we can assume that it’s a beneficial change without a great risk of making mistakes.
The last alternative that we are going to discuss here is to carry out tests on other platforms that give us a bigger audience or more volume of data. For example, we can do tests with different ads on Facebook or Google (testing different texts, photos, videos…) and see which ones bring us more clicks (CTR), donations, etc. And then apply the winners in other mediums (website, emails…)
What works best on Facebook or Google is not necessarily what will work best in other mediums, but if we do not have volume to do A/B tests with our own audience, at least we can evaluate what texts or visual elements generate more interest in our target audience.