We’ve compiled 9 great examples from charities and nonprofit organizations that have created good annual reports to inform their constituents of their activities and social impact during the year:
Dream
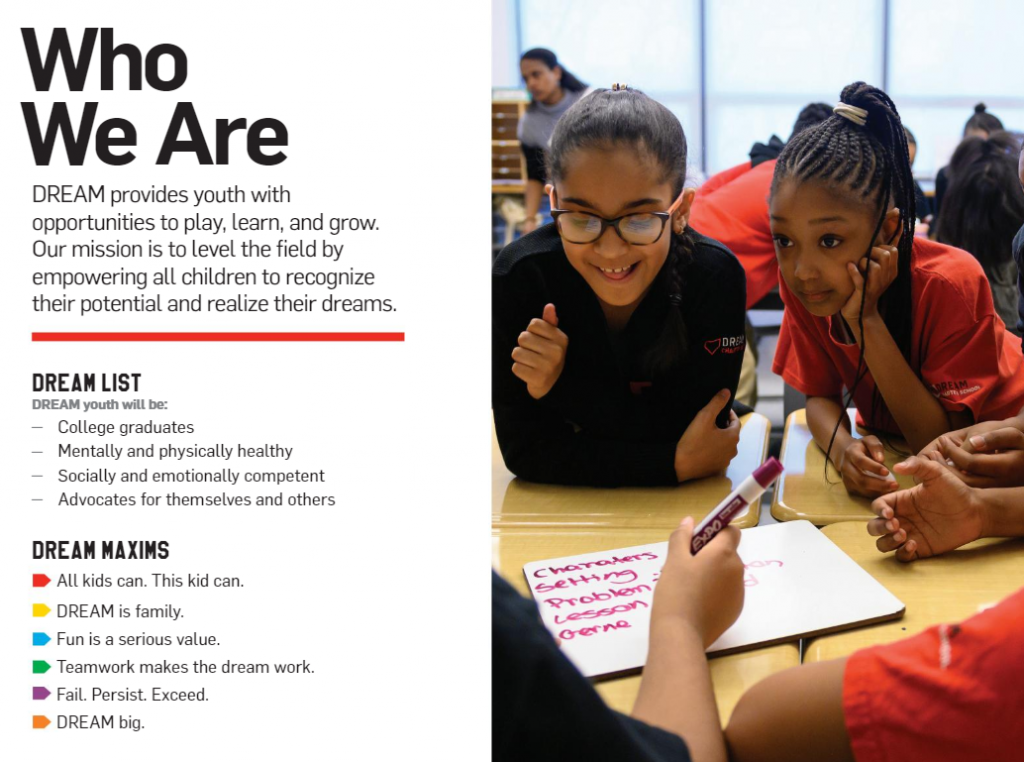
1. They begin the report by explaining “who we are”, highlighting what specific impact they want to have on children (“DREAM LIST”) and the basic principles of the organization (“DREAM MAXIMS”).
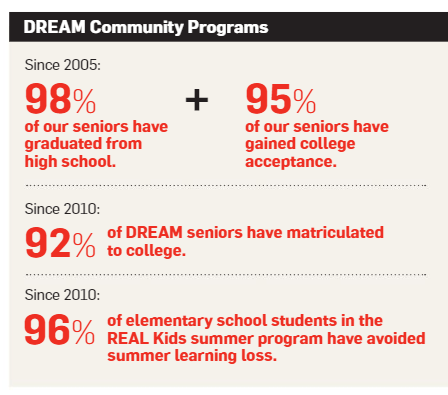
2. They show statistics of what they have achieved, not only in the last year but since they started their work.
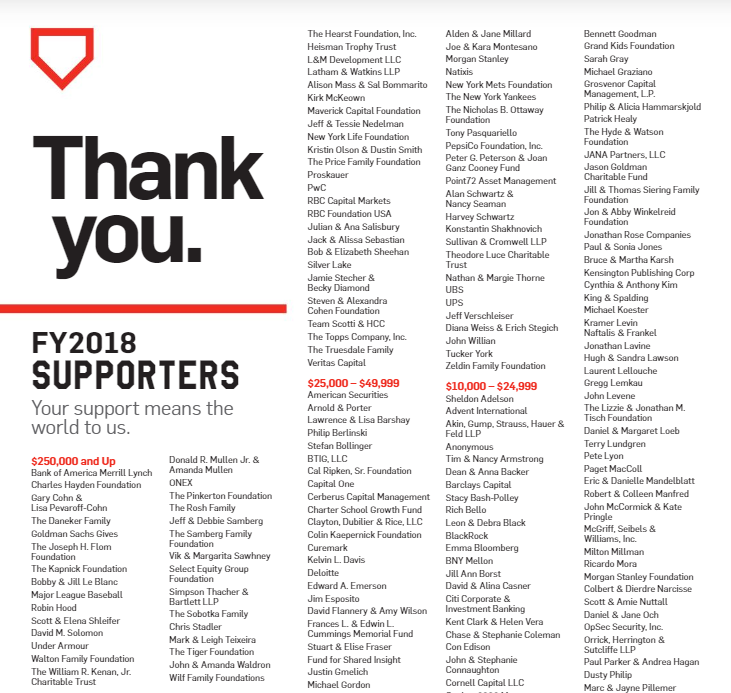
3. They show a large list of donors to thank them.
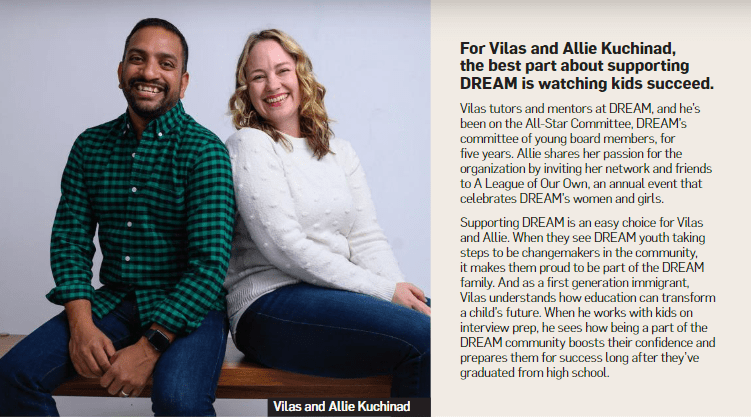
4. They also show a testimonial with a photo of a couple of collaborators, which helps make the huge list of donors less “impersonal”.
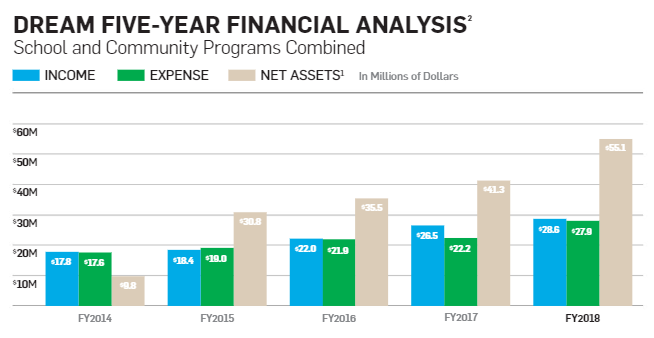
5. They show financial figures for the last 5 years, to illustrate the growth of the organization.
Many organizations show only the figures for the last year, which does not allow the reader to see the evolution that the organization is having (they see only an isolated figure that does not tell them much, because they have nothing to compare with).
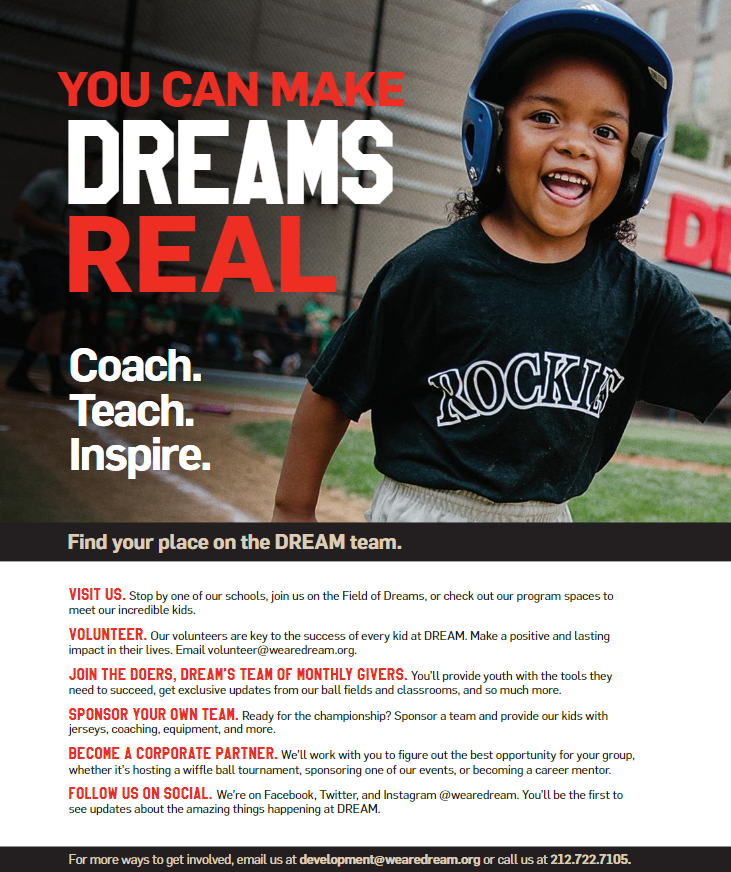
6. They take advantage of the last page of the report to encourage people to collaborate and to remember the different collaboration options that they offer.
350
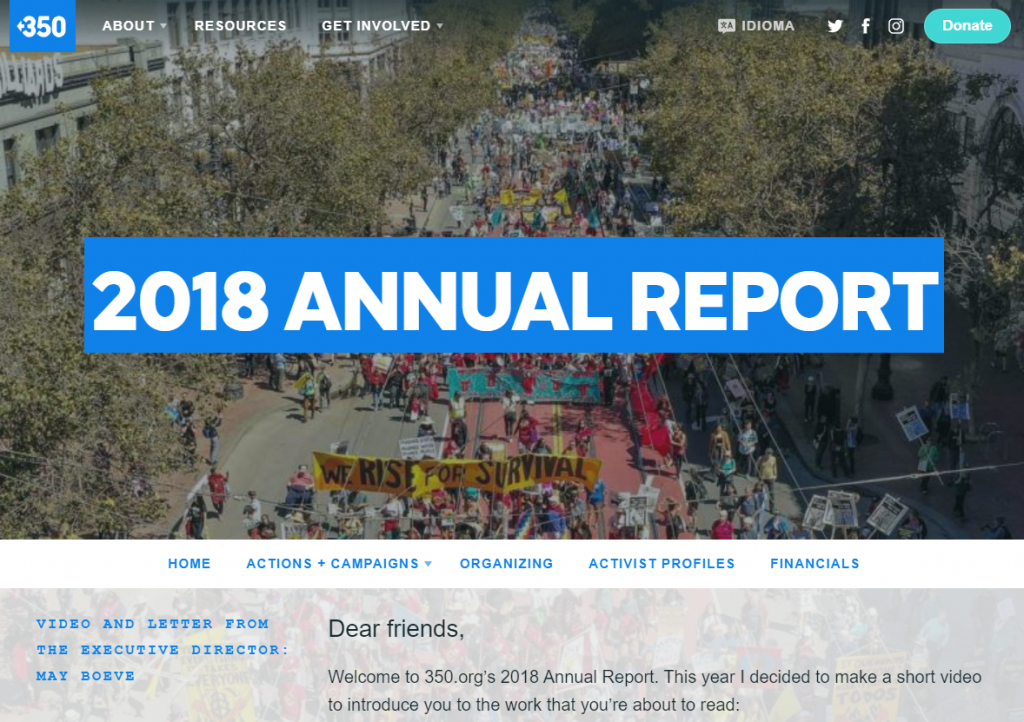
1. They use a web format instead of the typical PDF. They start the report with a video of their Executive Director and then links to the different sections, so the user can easily check only the info they are interested in.
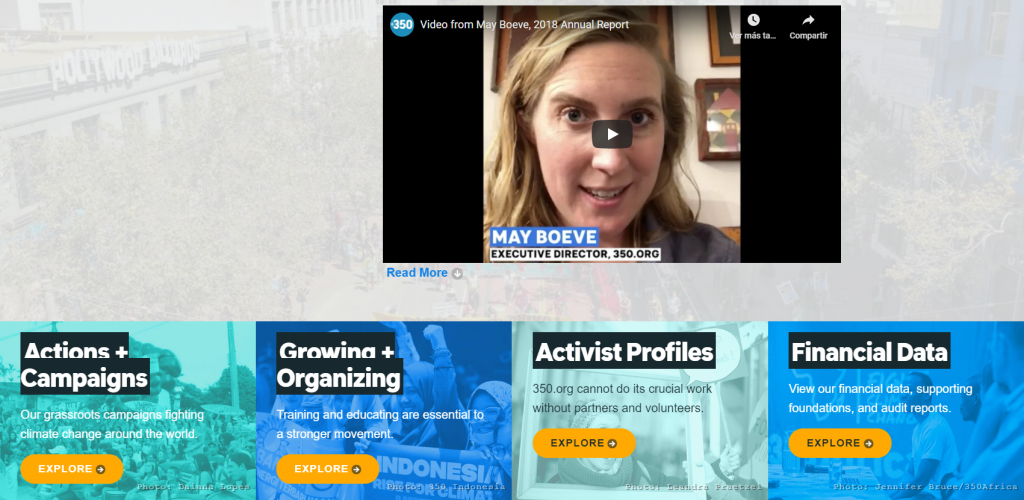
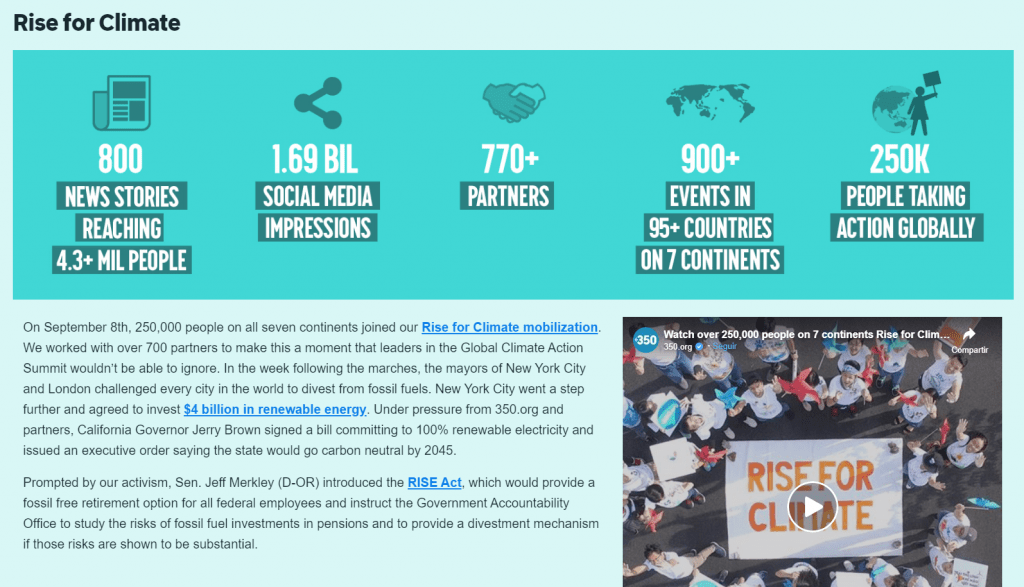
2. They show statistics of their main actions and campaigns, including links and even videos for more details.
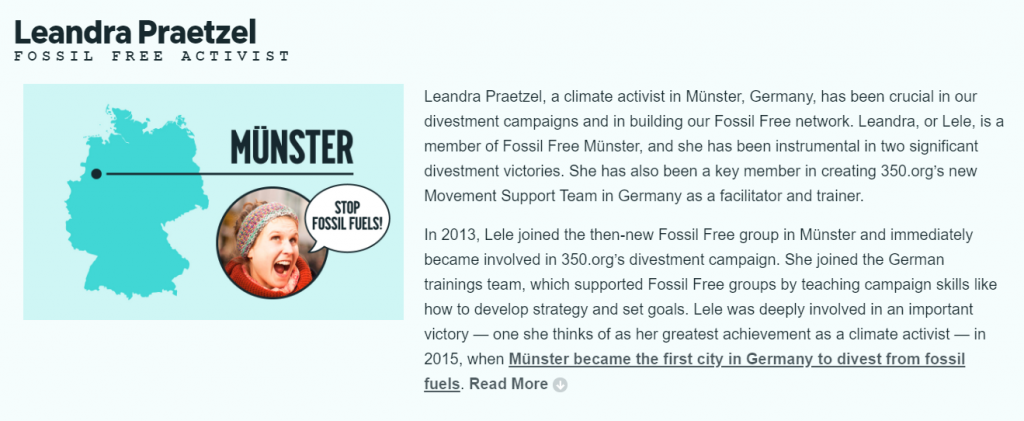
3. They show profiles of activists who have carried out outstanding initiatives during that year.
It is an interesting approach, because programs and donors are usually highlighted in annual reports, but many don’t mention the people that carried out those programs and actions (volunteers, workers, partners…). In the end, that personal element is key to achieving goals and also allows people to feel more attached to the cause.
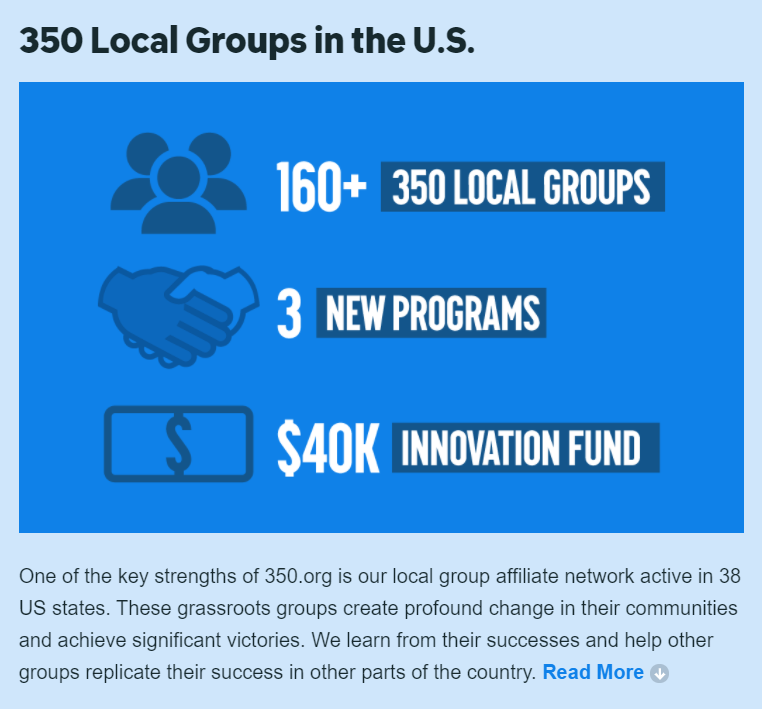
4. They also explain the internal news of the organization (training courses, creation of more local groups, etc.), which are not usually explained in the annual reports but are key to increasing the social impact later (capacity building).
Liberty in North Korea
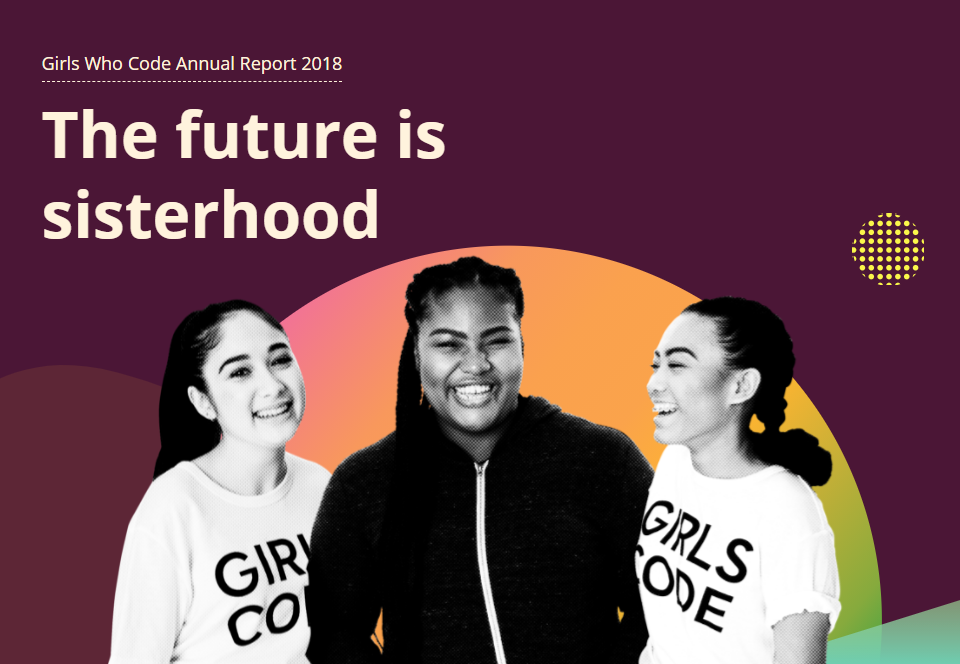
1. The report has a great design. It’s beautiful and displays the information in an attractive way. It is very different from the typical PDF with very long texts that few people end up reading.
2. They start with the vision and mission of the organization, which can serve to clarify their goals and inspire the readers if they were not familiar with their cause.

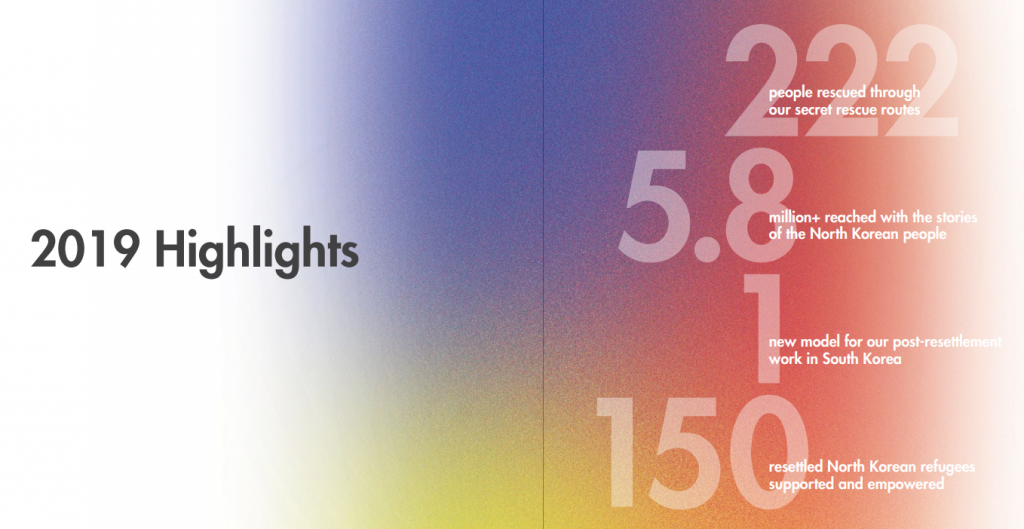
3. The main figures below show the impact they have achieved during the year.
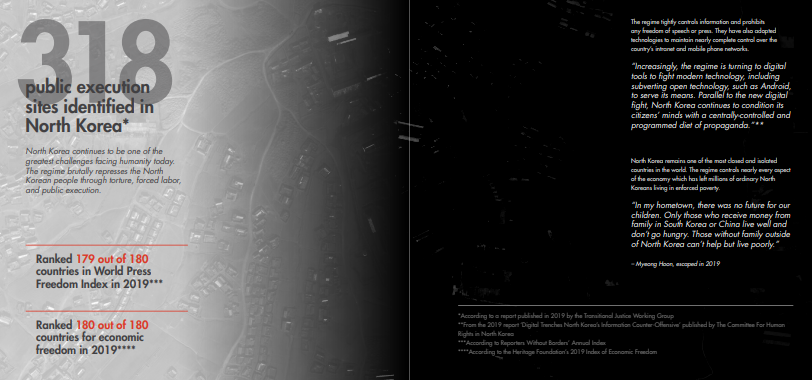
4. Then they go on to explain the main challenges that have been encountered during the year, including both official statistics (mentioning the source for extra trust) and personal testimonies.
It is an interesting approach because many annual reports focus on highlighting the good things that the organization has provided, but they do not remember the challenges that still exist and that will probably have to be addressed in the coming years.
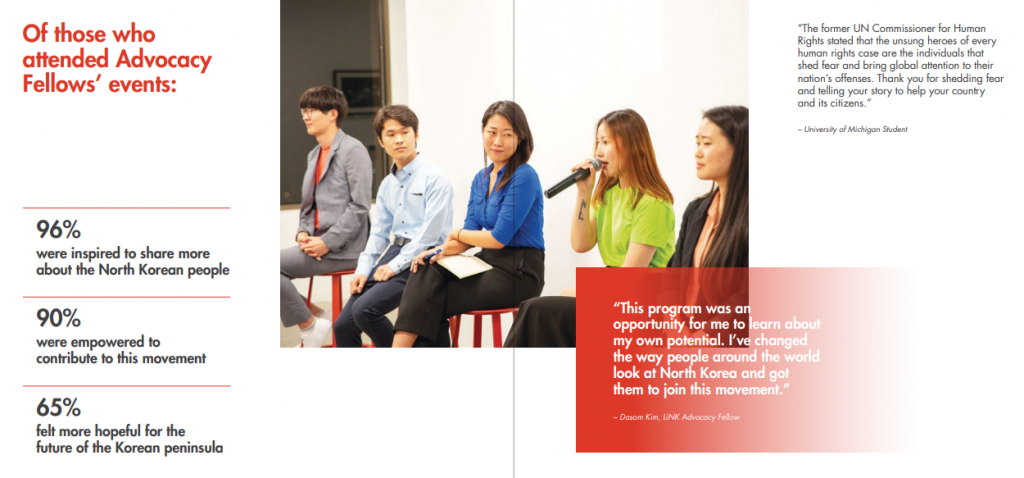
5. They show statistics of the impact of their events, as well as testimonials and photos.
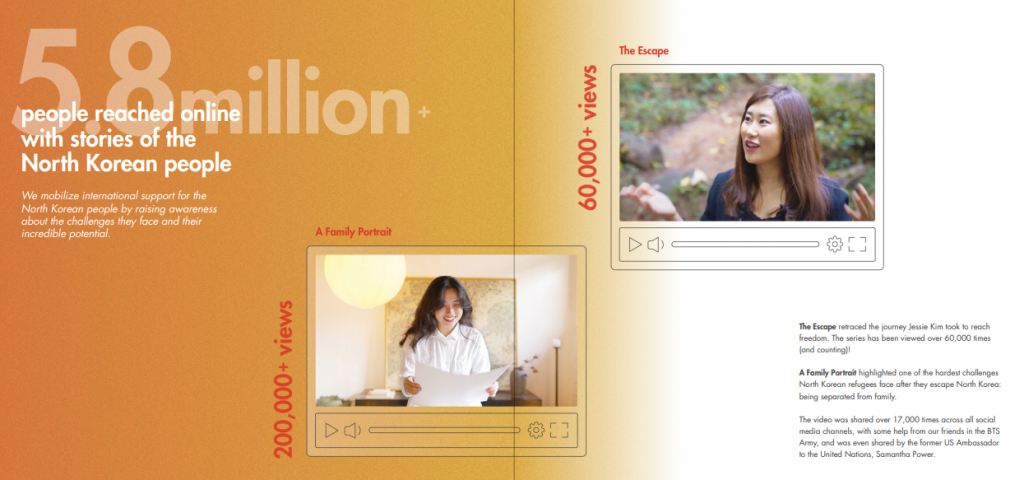
6. They show that millions of people have been reached thanks to their online videos (probably a much bigger audience than could be reached through traditional media)
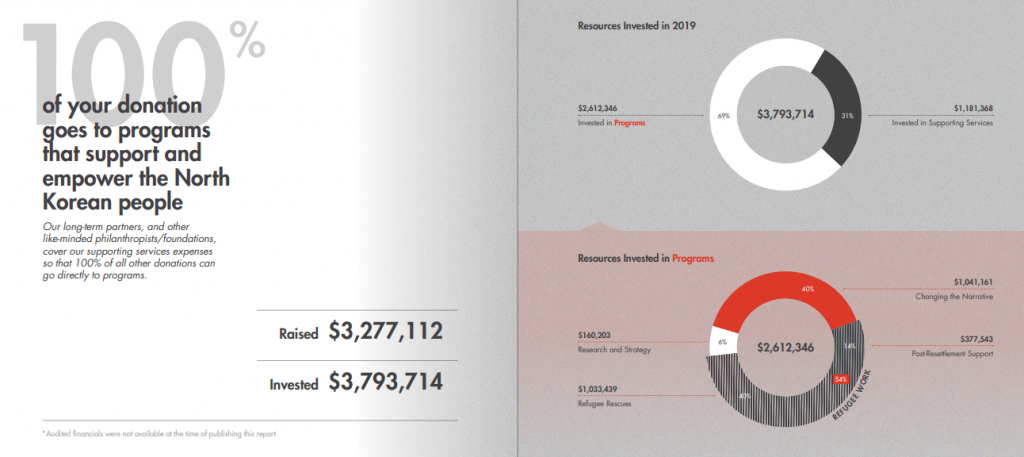
7. It briefly summarizes their budget for the year and highlight that “100% of your donation goes to programs” (other sources of funds cover their operating expenses).
Girls Who Code
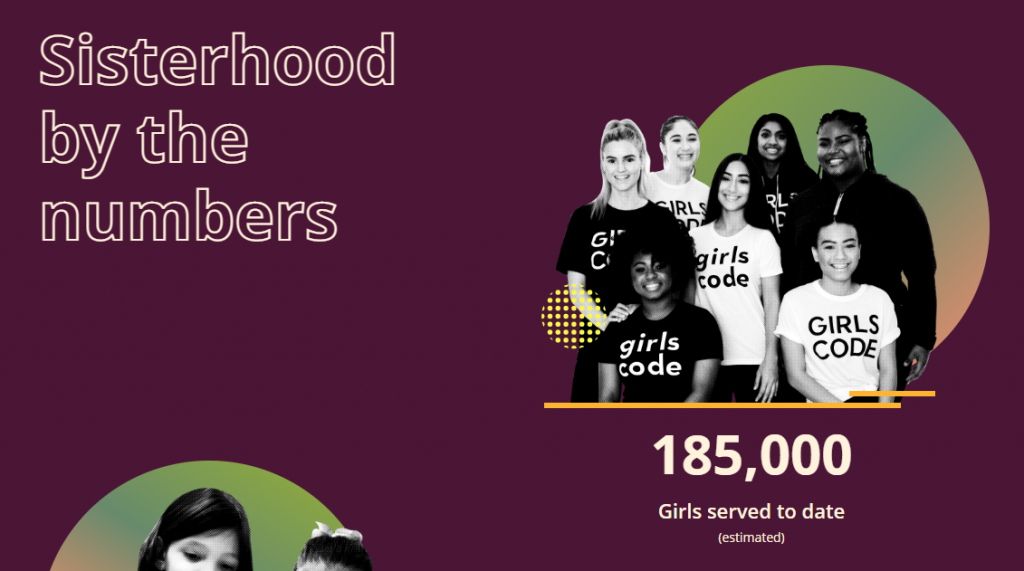
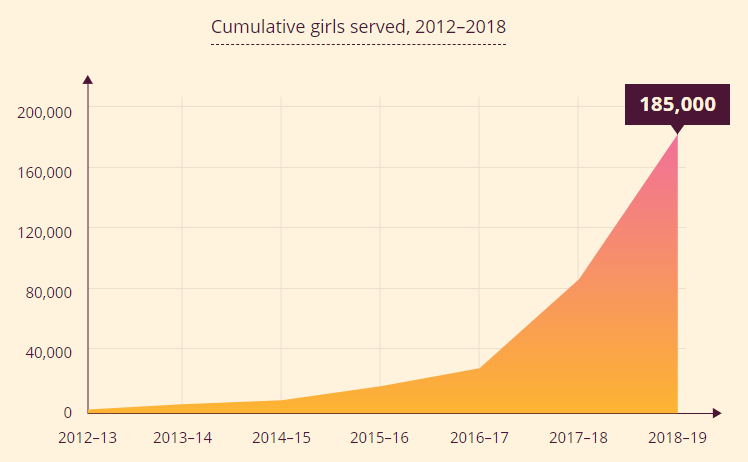
1. They show the main impact figures at the beginning, presented in a very attractive format.
2. Not only do they show the specific figures for that year, but they also show a graph to make it clear that the impact of the organization is increasing.
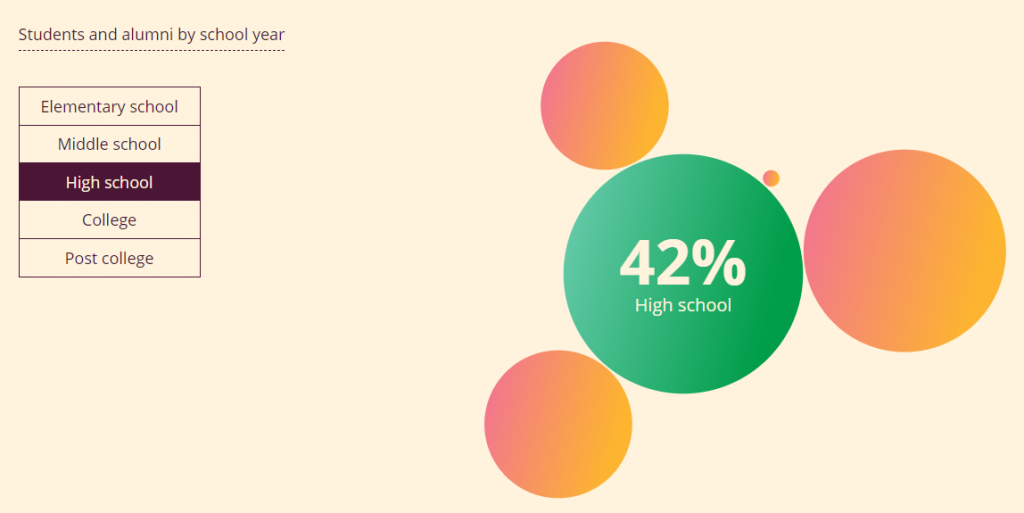
3. Some graphs are interactive. In this case, data is displayed according to the segment you click on.
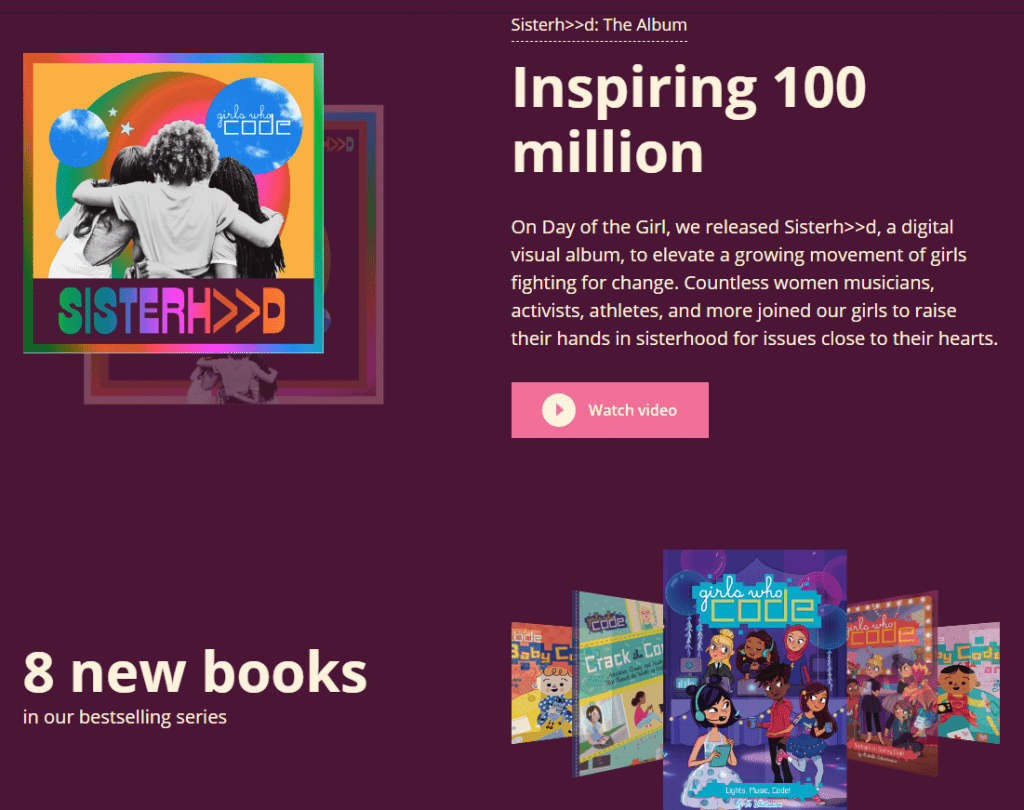
4. They show links to several of their online initiatives (visual album, books and podcast) in the report itself.
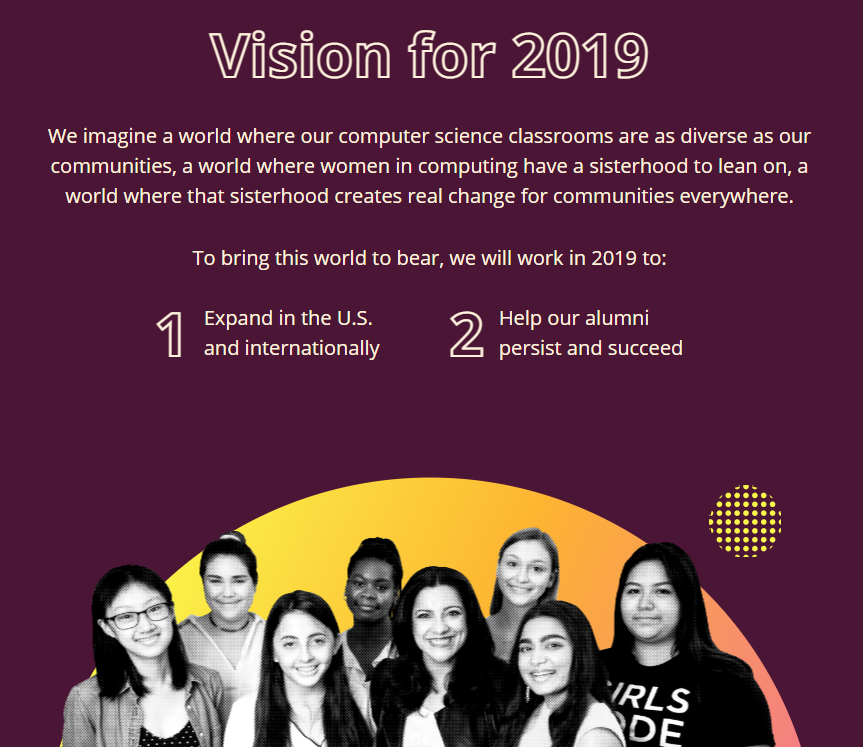
5. They explain their vision for the coming year.
6. The report has a top menu that allows easy navigation through the different sections of the report and a button to download it in PDF.

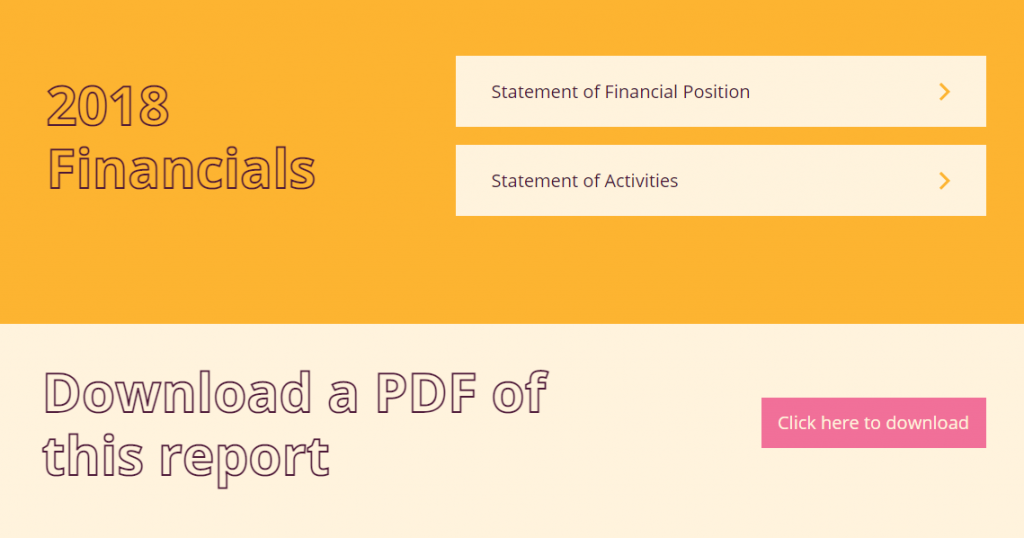
7. At the end of the report there are also links to their financial reports and the PDF version of the annual report, for people who want to access that information.
By doing this, they don’t bore people with lot of financial data in the main report (most people are not interested in those details) and at the same time they could be measuring how many people download each document (and dedicate less resources in the future to the documents with less downloads).
Colorectal Cancer Alliance
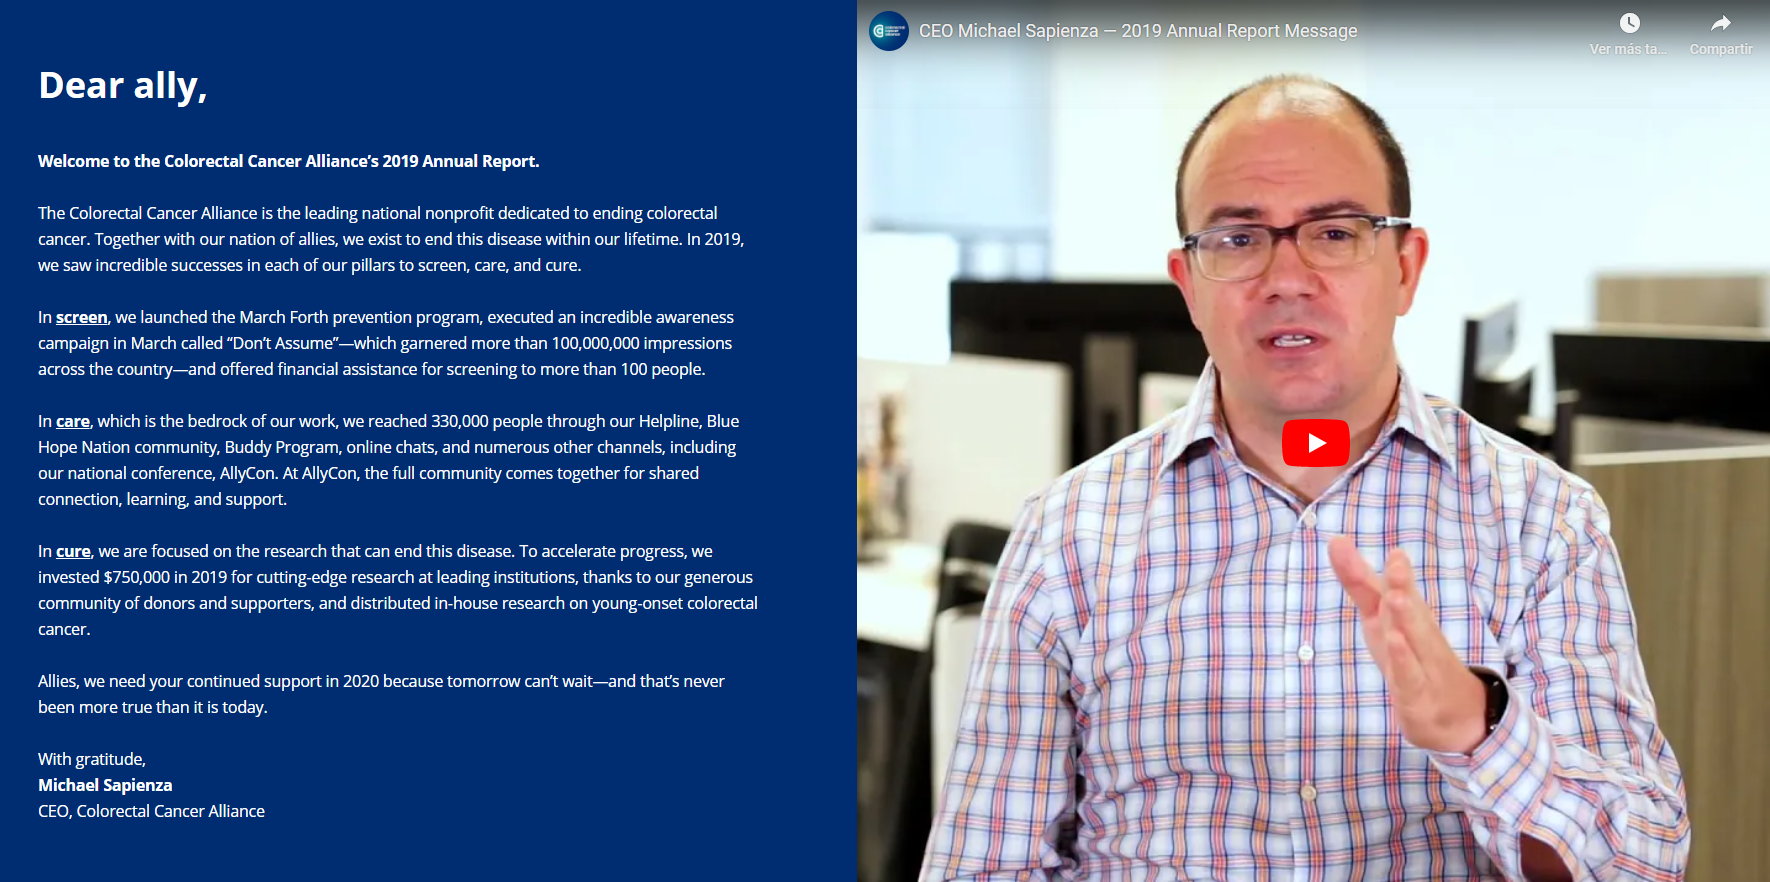
1. They have created a report in web format instead of the typical PDF (using the Yearly.report tool )
This gives them a couple of advantages: The contents adapt perfectly to different screen sizes (computers, phones and tablets) and they can insert interactive resources. They take advantage of this already in the first section, where they accompany the CEO’s letter with a video.
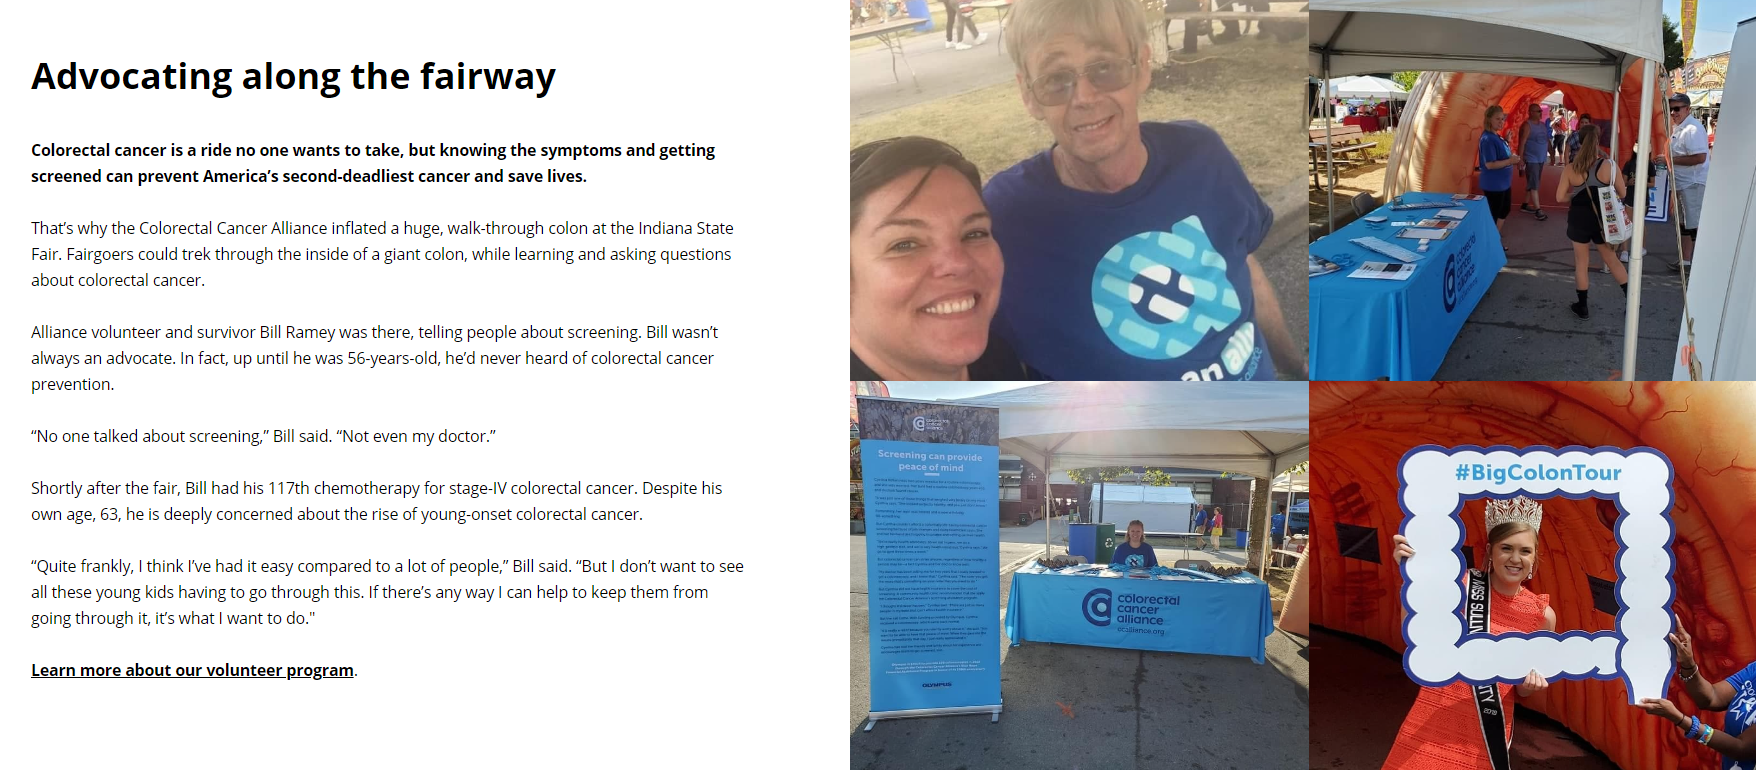
2. They show many links to relevant information and key pages for the organization, as in this case where they link to their volunteer program.
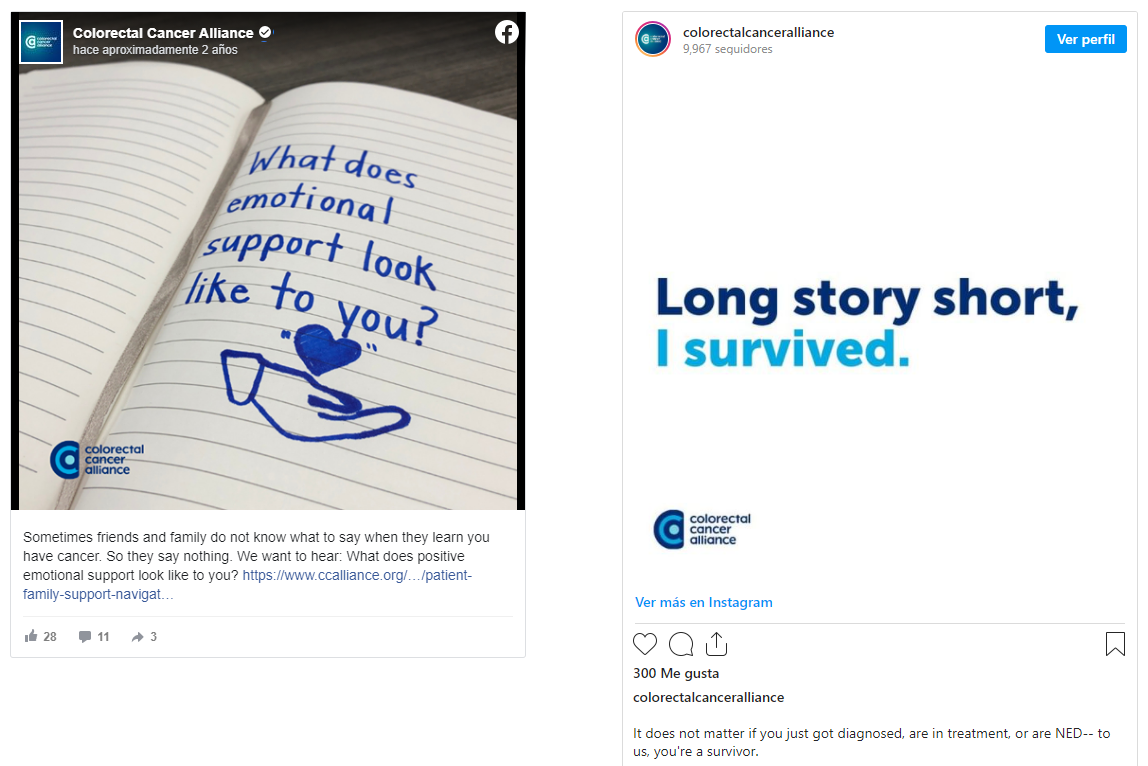
3. Some social media posts (in this case, a Facebook post and an Instagram post) are inserted into the report itself . It is a quick way to show what they have done during the year, show the impact that their publications have achieved and even attract new followers directly from the report.
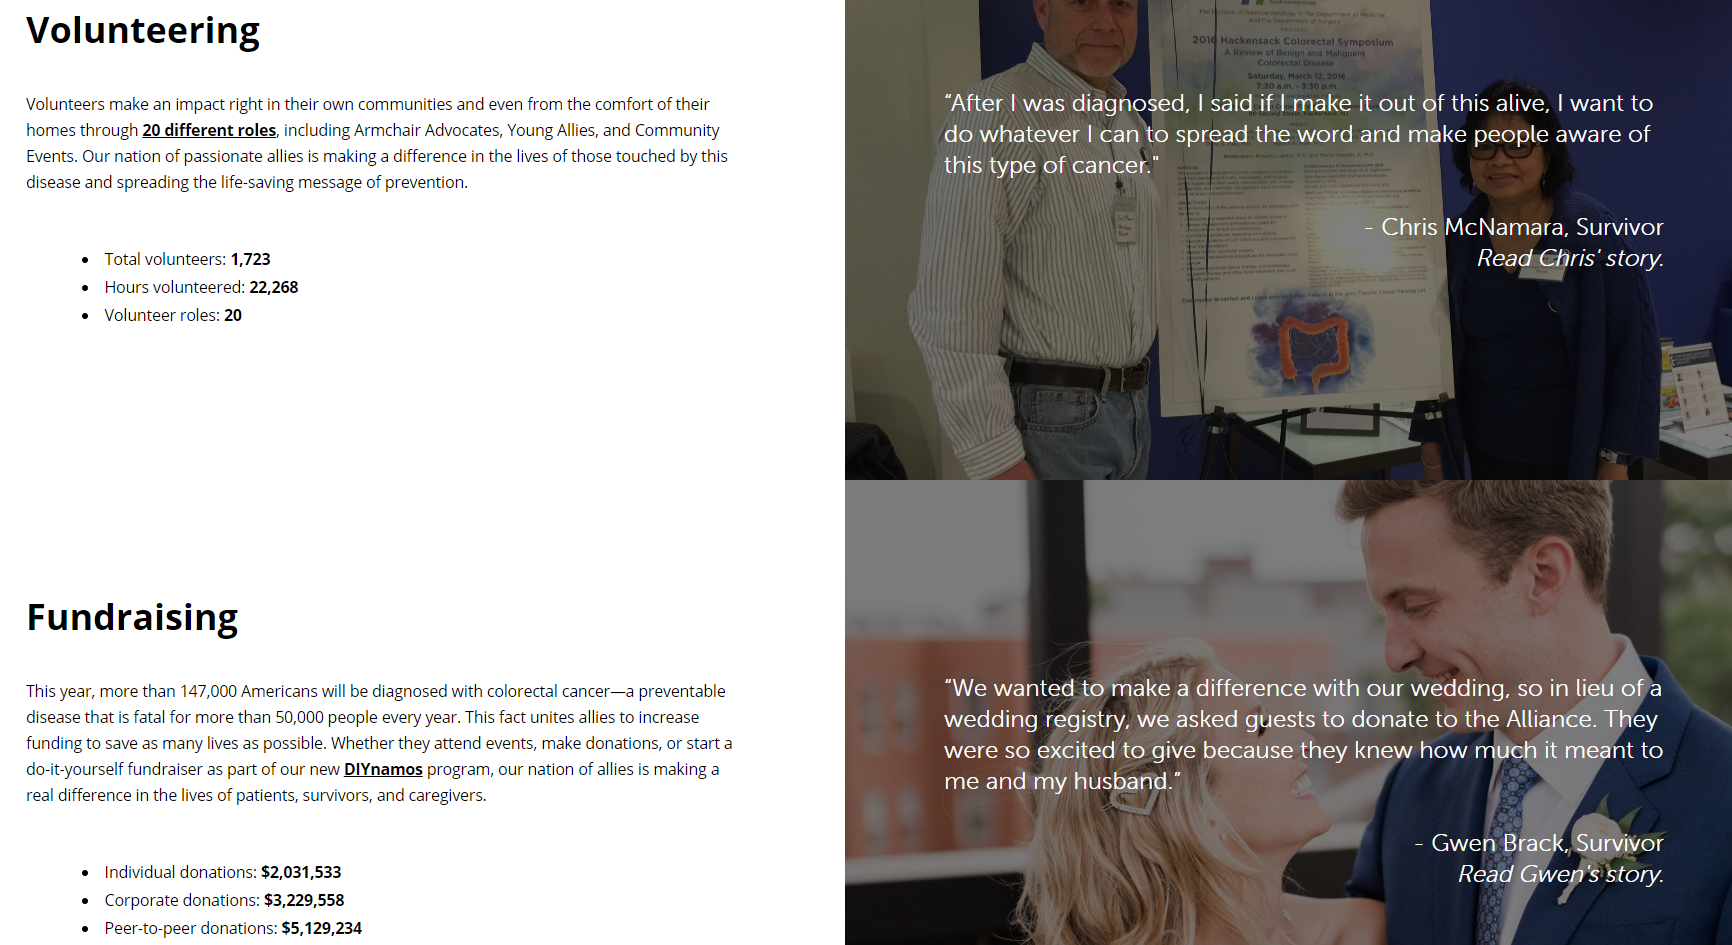
4. They simultaneously show relevant figures on volunteering and fundraising, testimonials with images, and links to the relevant pages.
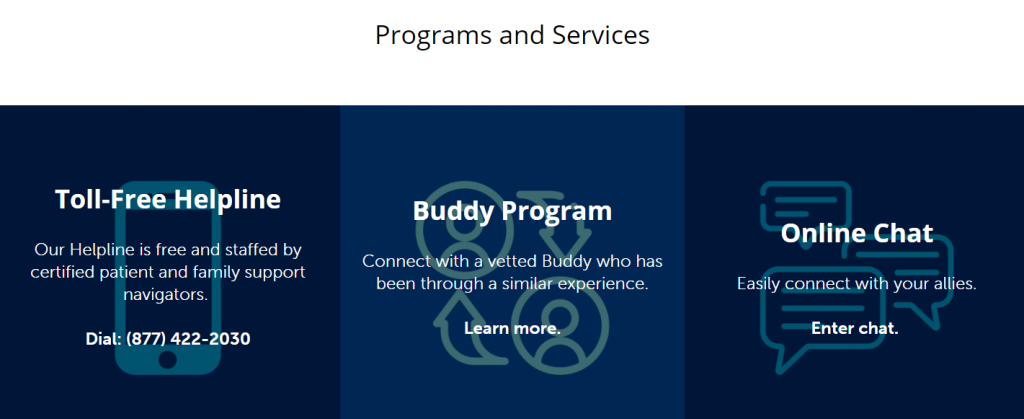
5. At the end of the report they put links to their main programs and services. They use the report not only to give information about what they have done in the past, but also to increase their impact in the future.
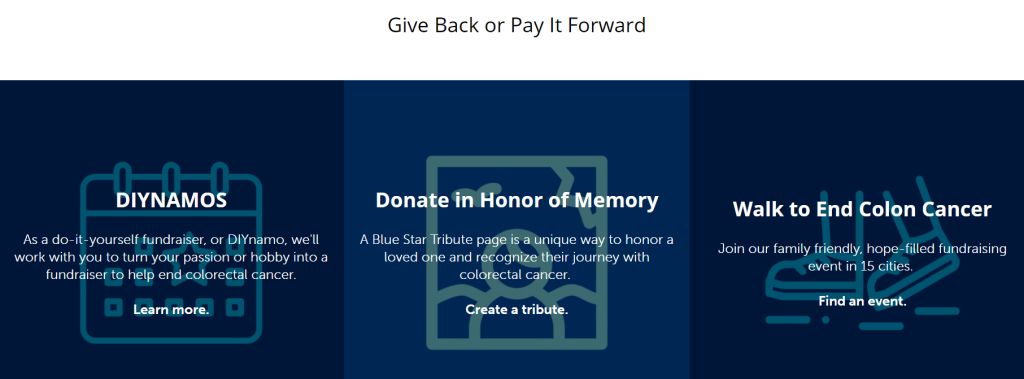
6. They also include links to the different options to help the cause.
American Red Cross
1. They take advantage of the report in video format to show testimonials from people who have benefited from the work of the organization.
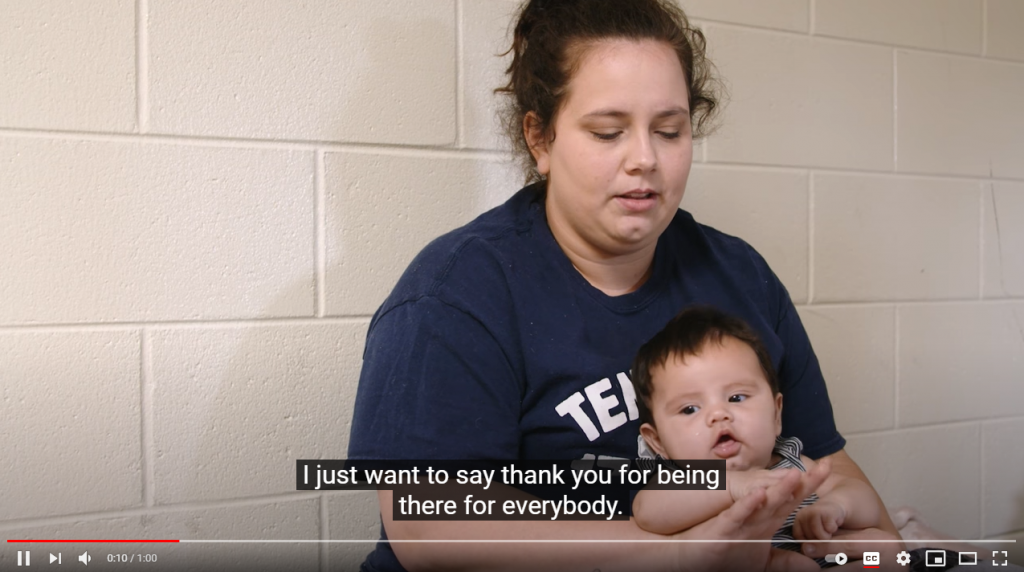
2. They alternate personal testimonials with global statistics of the organization’s impact during that year.
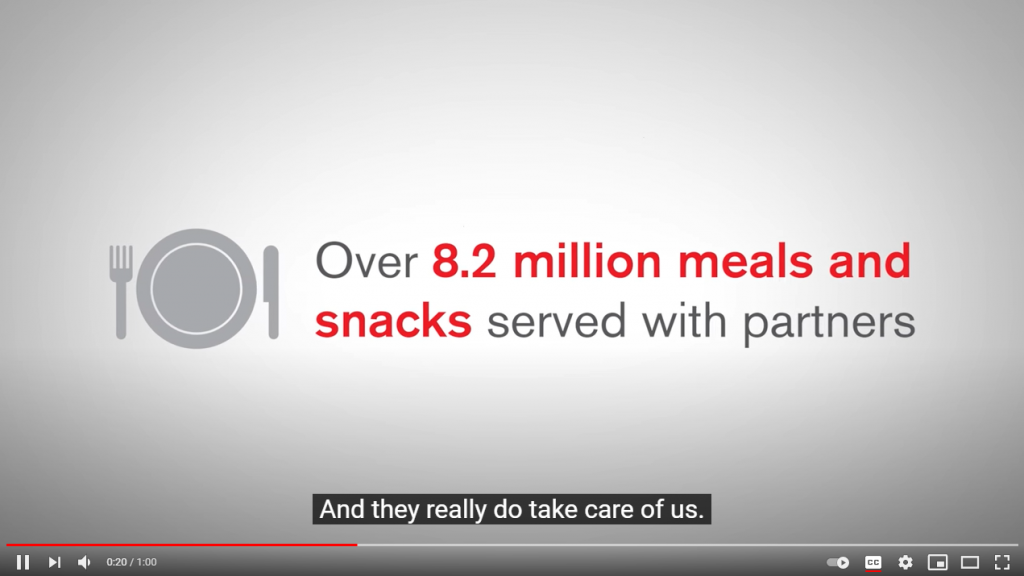
It is a simple video (easy to create), but it perfectly fulfills its goal. It is more visually appealing and can generate more emotional reaction than the typical PDF report with dozens of pages that most people don’t want to read.